Appearance
Skip to content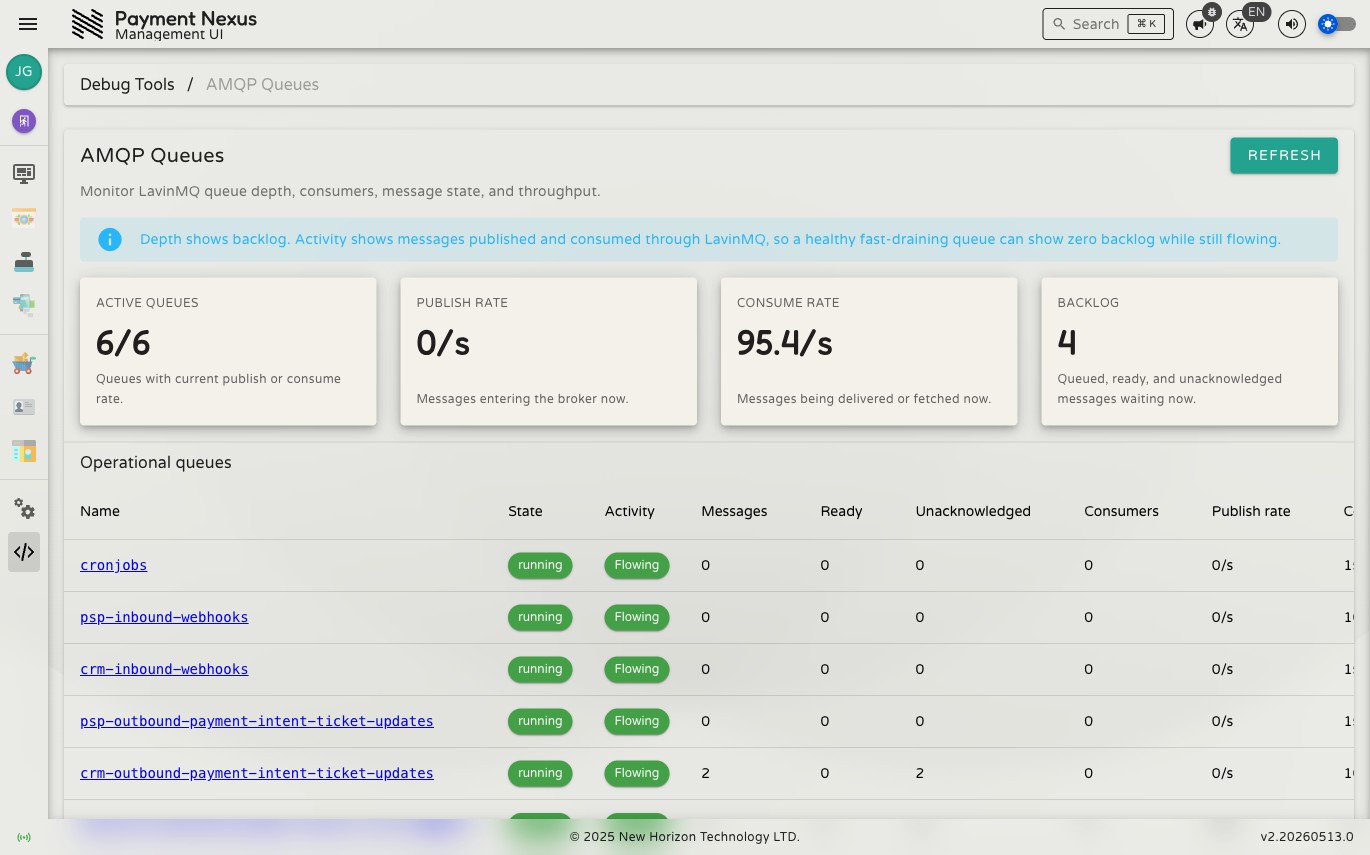
AMQP Queues
Payment Nexus uses LavinMQ as its AMQP message broker to process background jobs asynchronously — inbound webhook callbacks from PSPs, outbound notifications to CRM systems, scheduled tasks, and more. The AMQP Queues page surfaces the real-time state of every queue in the broker so you can see what's flowing, what's stuck, and what has failed.
Permissions
| Action | Permission required |
|---|---|
| View queue status | queues:monitor + application:administer |
| Replay or discard messages | queues:manage + application:administer |
Summary metrics
Four headline figures appear at the top of the page, updated in real time via WebSocket:
| Metric | What it shows |
|---|---|
| Active Queues | Queues with a current publish or consume rate greater than zero, shown as active / total |
| Publish Rate | Messages entering the broker right now, in messages per second |
| Consume Rate | Messages being delivered to or fetched by consumers right now, in messages per second |
| Backlog | Total messages waiting across all queues — the sum of ready and unacknowledged messages |
TIP
A healthy system can show zero backlog while still flowing. Backlog shows depth, not throughput. A fast-draining queue may process thousands of messages per second while maintaining near-zero depth.
Operational queues
The main table lists all operational queues. Click any row to open the queue's detail page.
| Column | Description |
|---|---|
| Name | Queue identifier |
| State | Broker-reported queue state (e.g. running) |
| Activity | Flowing — active publish or consume rate; Idle — past activity but none now; No activity yet — never used |
| Messages | Total depth: ready + unacknowledged |
| Ready | Messages waiting to be delivered to a consumer |
| Unacknowledged | Messages delivered to a consumer but not yet acknowledged (in-flight) |
| Consumers | Number of active consumers connected to this queue |
| Publish rate | Messages per second currently entering this queue |
| Consume rate | Messages per second currently being delivered from this queue |
| Published | Lifetime total of messages published to this queue |
| Consumed | Lifetime total of messages consumed from this queue |
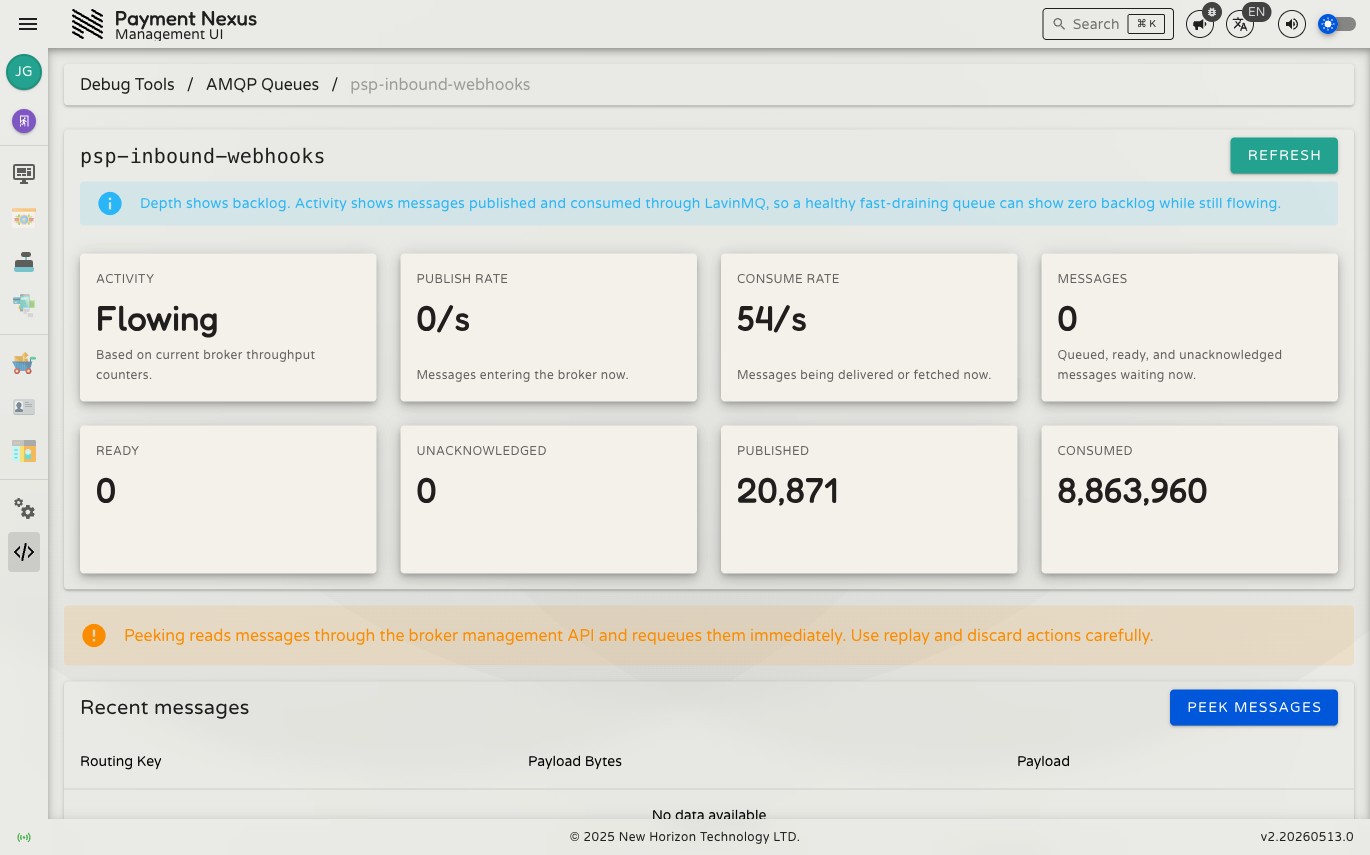
Queue detail
The detail page repeats the same metrics as summary cards and adds a Peek action. Peeking loads up to 10 messages from the front of the queue and displays their routing key, payload size, and raw payload. Messages are immediately requeued after being peeked — it is a read-only operation.
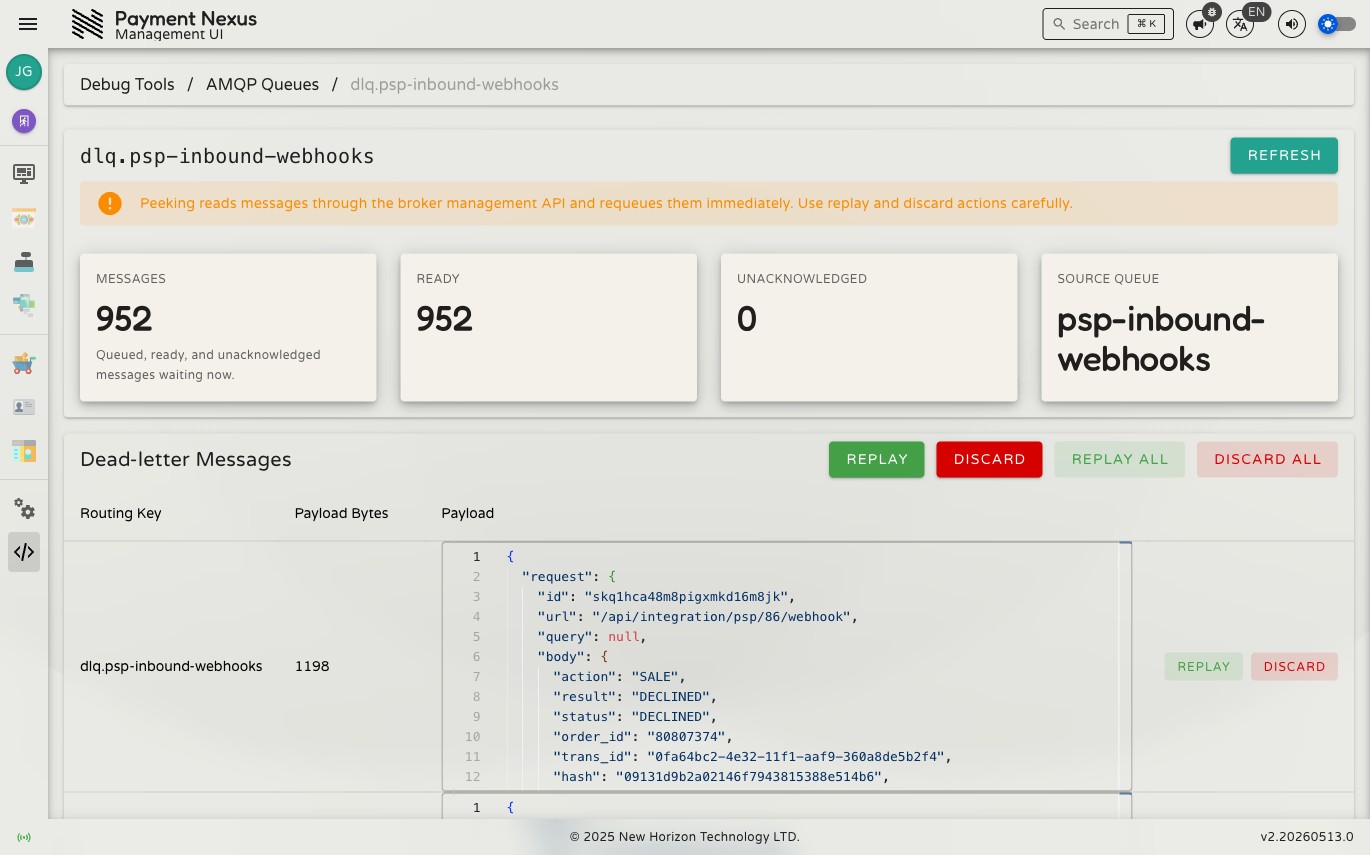
Dead-letter queues
Every operational queue has a corresponding dead-letter queue (DLQ), named dlq.{queue-name}. When a message is rejected or cannot be processed — for example because a PSP webhook payload was malformed or a downstream service was unavailable — it is routed to the DLQ rather than being silently dropped.
The DLQ section at the bottom of the main queues page lists all dead-letter queues with the same metrics as the operational table. Click a DLQ row to open its detail page, which shows the failed messages and provides four actions:
| Action | What it does |
|---|---|
| Replay | Move the oldest message back to its source queue for reprocessing |
| Discard | Permanently delete the oldest message |
| Replay all | Move all messages in the DLQ back to their source queue |
| Discard all | Permanently clear the entire DLQ |
Per-message replay and discard are also available directly in the message table rows. All destructive actions require confirmation.
WARNING
Replaying a message re-submits it to the same queue that originally rejected it. If the underlying problem has not been resolved, the message will fail again and return to the DLQ.