Appearance
Skip to content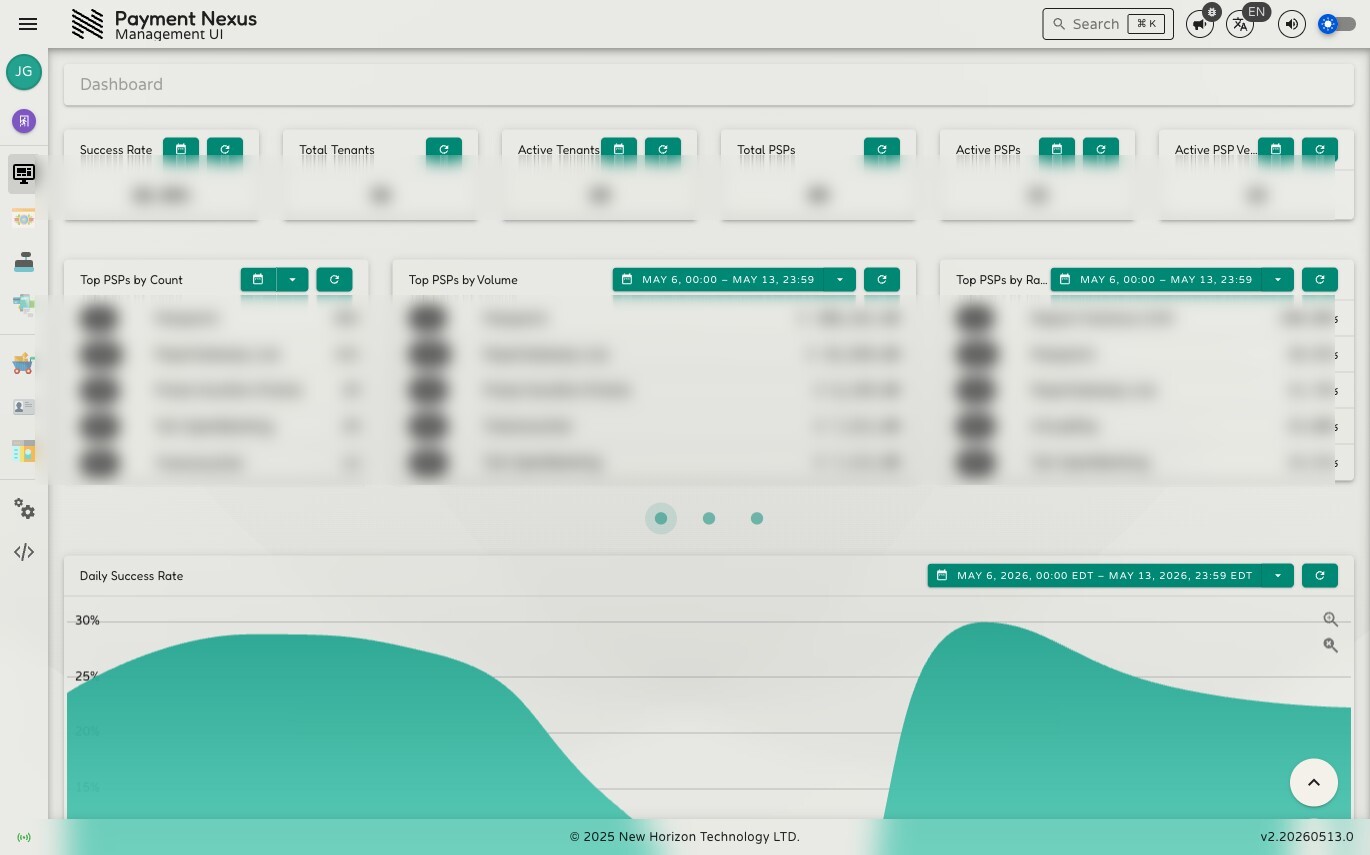
The Dashboard
The dashboard is the first thing you see after logging in. It gives a live overview of system health and payment activity — useful for a quick daily check or for spotting a drop in approval rates before it becomes a support issue.
The widgets shown depend on your permissions. Users without access to a given module won't see the widgets for it. If you have no dashboard permissions at all, the dashboard shows navigation cards to the modules you do have access to instead.
Stat Widgets
The top row shows six at-a-glance metrics. Each has a refresh button. Those marked as date-range aware also have a date picker — the value updates to reflect the selected period.
| Widget | What it shows |
|---|---|
| Success Rate | Overall payment approval rate as a percentage across the entire system for the selected period |
| Total Tenants | Total number of tenant records in the system — not date-range filtered |
| Active Tenants | Number of tenants that processed at least one payment in the selected period |
| Total PSPs | Total number of PSP integrations in the system — not date-range filtered |
| Active PSPs | Number of PSP integrations that processed at least one payment in the selected period |
| Active PSP Vendors | Number of distinct PSP vendor types with active traffic in the selected period |
Top Performers
The middle section is a carousel of ranked leaderboards, showing the top five entries for each metric. Use the pagination dots to move between pages:
PSPs
| Widget | What it shows |
|---|---|
| Top PSPs by Count | PSPs ranked by number of approved payment intents in the period |
| Top PSPs by Volume | PSPs ranked by total approved payment volume (EUR) in the period |
| Top PSPs by Rate | PSPs ranked by approval rate (%) in the period |
PSP Vendors
| Widget | What it shows |
|---|---|
| Top PSP Vendors by Count | PSP vendor types ranked by approved payment intent count |
| Top PSP Vendors by Volume | PSP vendor types ranked by approved payment volume (EUR) |
| Top PSP Vendors by Rate | PSP vendor types ranked by approval rate (%) |
Tenants
| Widget | What it shows |
|---|---|
| Top Tenants by Count | Tenants ranked by number of approved payment intents |
| Top Tenants by Volume | Tenants ranked by total approved payment volume (EUR) |
| Top Tenants by Rate | Tenants ranked by approval rate (%) |
Charts
The bottom section is a carousel of time-series charts, each showing daily data across the selected date range. Use the pagination dots to move between charts. Each chart has its own date range picker and zoom controls.
System-wide
| Chart | What it shows |
|---|---|
| Daily Success Rate | Overall payment approval rate (%) plotted by day — the quickest way to spot a system-wide decline |
| Daily Payment Intents | Count of approved vs non-approved payment intents per day across the whole system |
| Daily Payment Intent Volume | Total value (EUR) of approved vs non-approved payments per day across the whole system |
By Tenant
| Chart | What it shows |
|---|---|
| Daily Tenant Success Rate | Approval rate (%) per day, with a separate series for each tenant — shows which tenants are driving rate changes |
| Daily Active Tenants | Number of tenants with payment activity each day |
| Daily PITs by Tenant | Approved payment intent count per day, broken out by tenant |
| Daily Volume by Tenant | Approved payment volume (EUR) per day, broken out by tenant |
By PSP
| Chart | What it shows |
|---|---|
| Daily PSP Success Rate | Approval rate (%) per day, with a separate series for each PSP — shows which integrations are underperforming |
| Daily Active PSPs | Number of PSP integrations processing payments each day |
| Daily PITs by PSP | Approved payment intent count per day, broken out by PSP |
| Daily Volume by PSP | Approved payment volume (EUR) per day, broken out by PSP |
By PSP Vendor
| Chart | What it shows |
|---|---|
| Daily PSP Vendor Success Rate | Approval rate (%) per day, with a separate series for each PSP vendor type |
| Daily Active PSP Vendors | Number of distinct PSP vendor types active each day |
| Daily PITs by PSP Vendor | Approved payment intent count per day, broken out by PSP vendor type |
| Daily Volume by PSP Vendor | Approved payment volume (EUR) per day, broken out by PSP vendor type |